After getting into conference play in college basketball, trends emerge who the real contenders are and who fooled us by beating up on cream puffs in nonconference building up a gaudy record.
As we reach the midpoint of conference play around the country, there are triggers to watch that are potential indicators of whether it makes sense to back hot or cold teams and which way or ways you should look at betting on certain teams.
Hot Teams Profile
What determines “hot” in conference play?
- Winning 75% of all games and covering 60+ percent of point spreads
- One of the three Best Teams in the Conference Standings
- Shoot Over 46.5% from the field
- Defense Allows 41% or less shooting
There are other factors, but these are strong choices because you can use a quick overlook in making determinations.
If a team wins, covers many spreads, defends, and makes shots at an above-average clip, they probably don’t have many faults, at least not on the surface.
All of these elements point to consistency. That doesn’t mean they cover the number all the time because other factors arrive and no matter what, no squad has their A-Game each time out. Instead, these clubs give a dependable effort the vast majority of the time and you can often find manageable point spreads they can beat.
Cold Teams Profile
What determines “cold” in conference play?
- Winning 40% to 45% (or less) of all games and covers similarly, just not always the SU outcome
- One of the bottom 25% in the Conference Standings
- Shoots below 42% from the field
- Defense Allows 46.5% or higher shooting
This chilly club finds it hard to win and beat the oddsmakers‘ number because they don’t shoot with much accuracy and lack talent or connectivity on defense.
While it is easy to figure out when a team loses both outright and against the number, these are usually unreliable in other ways. They could be a 12-point underdog, but in one game they make a few extra three balls and cover a spread. In the next game, they face a peer in the standings and make a larger-than-expected number of long shots to win. Then the next time out where you feel they might be turning a corner and are catching double digits again, they shot 4-for-20 from deep and lose by 20.
It’s not a good practice to expect bad teams to do good things.
Dare to Be Perfect?
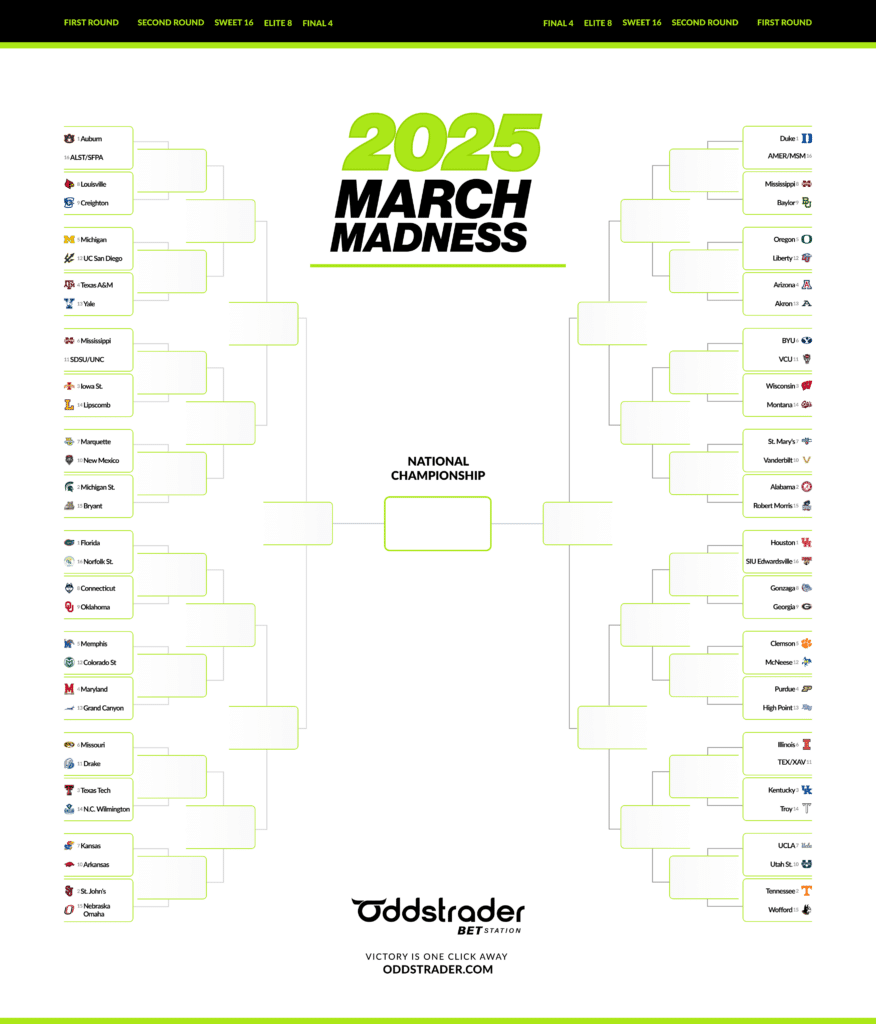
Get ready for the madness! March Madness 2025 is here, and it’s time to lock in your picks. Download our free printable bracket to track every game, predict the winners and compete with friends.
Simply click the image below to grab your bracket and start making your selections. Don’t miss your shot at bragging rights—fill yours out today!
Hot Teams Phony Profile
Every year in the latter stages of conference play, some team with a strong record and above-average ATS mark falls off the cliff in the middle to late February. Maybe it’s noticed, maybe not, but there are usually telltale signs.
Maybe their schedule was front-loaded with easier competition and you might not have noticed the games they were covering were beating the number by a point or two and far from dominating.
Then you discover the offense or defensive numbers were not as good as they were in the first part of the conference season with erosion across the board. This could be your sign of regression and that’s where it is smart to check their season numbers for and against and what direction those categories are headed.
In two quick weeks, this type of outfit could go from hot to ice cold without paying attention to the numbers.
Cold Teams Undervalued Profile
These units become easy to spot. They opened 4-7 in nonconference play, yet had a better ATS mark. They began 3-6 in conference play, yet are 5-4 or better facing the spread, and upon closer inspection, their shooting numbers are rising like bread out of the oven. The defense, that was permitting 46 percent on the season, has not conceded more than 42% once in the last five games.
Sure, the schedule could have something to do with the changes, yet invariably, these are ideal underdogs to back because they are sliding under the number to cover. Nevertheless, as their stature rises, they are usually poor favorites because they are still not a true quality squad. Watch for these squads’ catching points.


